
Influence of News Topics on Facebook-based Stress Impact Scores
10 minute read
My goal is to design a news recommendation engine that incorporates the potential stress impact to the user on reading the news articles.
30% of all time spent online is now allocated to social media interaction. How many times have you logged into Facebook with the intention of checking updates from dear ones only to find unpleasant news of politics and violence on top of your news feed? Negative news can significantly change an individual’s mood leading to distress and also degradation in productivity.
During working hours, the news recommendation engine can place low priority for negative news with high stress scores if previous activity from the user for similar news articles is not found. Intuitively, an article on violence/war is expected to induce a more negative reaction compared to an article on science/technology. To validate this hypothesis, I analyzed the reactions by the users to articles shared on Facebook by official pages of leading newspapers. My analysis shows that there is significant difference in potential stress impact across the different news topics.
The code for this blog is on GitHub.
1. Introduction
The amount of time people spend on social media for e.g., Facebook, Twitter etc. is constantly increasing. Teens now spend up to nine hours a day on social platforms, while 30% of all time spent online is now allocated to social media interaction. And the majority of that time is on mobile - 60% of social media time spent is facilitated by a mobile device. Source
With such widespread use of smartphones, the role of social networking websites has greatly transformed. Becoming popular as a fun way to share your vacation pictures with the world, Facebook feed has now turned into a one-stop destination for everything from creepily relevant advertisements to latest news on violence and destruction around the world. How many times have you logged into Facebook with the intention of checking updates from dear ones only to find unpleasant news of politics and violence on top of your news feed?
Negative news can significantly change an individual’s mood leading to distress and degradation in productivity. In this project, I analyze the potential stress impact of articles shared on Facebook and the variance of this impact based on the broad topic of the news article. Intuitively, an article on violence/war is expected to induce a more negative reaction compared to an article on sports/lifestyle. My initial goal is to validate such hypotheses using Facebook data available publicly. If we do observe significant variations based on news topics, we can potentially incorporate the topic dimension into news recommendation engines. For example, during working hours, the recommendation engine can place low priority for negative news with high stress scores if previous activity by the user for similar news articles is not found.
For the data collection, I utilize Facebook API to collect information including article link, likes and “reactions” information to news articles shared on the official pages of reputed newspapers around the world. Additionally, for each news article, I find out the broad topic category of the article either from the article’s link or by scraping the article’s main page. With the collected data, I perform various analyses including relationship between the negative and positive reactions to an article and the variance in stress score across news topics.
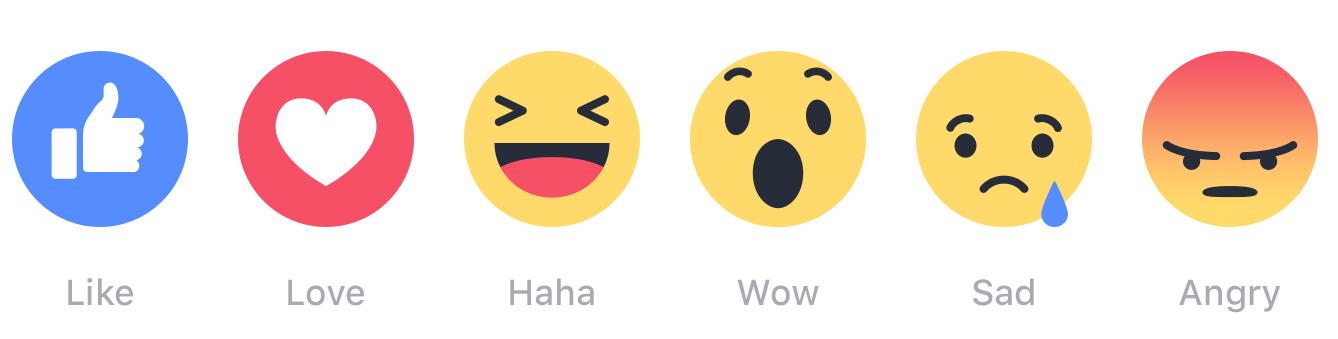
For those unfamiliar with Facebook reactions, these are additional emotions one can express for photos, posts and other content on Facebook apart from the “like” option which was the only reaction present previously. The available reactions are shown in the figure below the title.
2. Related Work
While researching during problem formulation of this project, I came across this highly relevant data science blog MyChillNews: An NLP-driven guide for conscious consumption of stressful news. In MyChillNews, the author computed Stress-Impact Scores for news articles using Facebook API data. The author trained machine learning models for stress impact prediction using the article’s title words as predictors. Moreover, the author built a web app that scrapes the top headlines from various newspapers’ main pages on a daily basis and computes the potential Stress Impact Score using the trained models. All in all, this is a fantastic project and served as motivation for my own analysis.
I found the analysis or active incorporation of news topic into the prediction model to be missing. It is possible a strong machine learning model can self-learn to classify topics based on words in the article titles. In contrast, my goal is to analyze the variance in stress impact scores across news topics without the use of article’s title and content.
3. Setup
# Data Collection
import urllib.request
import json
import datetime
import csv
import time
import requests
from bs4 import BeautifulSoup

# Data Transformation and Analysis
import numpy as np
import pandas as pd
pd.set_option('precision',10)

# Plotting
import matplotlib
import matplotlib.pyplot as plt
plt.rcParams['figure.figsize'] = [14,10]
import seaborn as sns
%matplotlib inline
4. Data Collection
For the data collection via Python using Facebook API, I was able to find baseline code available on GitHub. The top three sources I utilized are as follows:
The key extensions I performed include:
Extraction of news topics from news article links. The treatment had to be different for different newspapers. Please go through the __processFacebookPageFeedStatus function of NewspaperData class in the following cell.
Modified computation of stress impact score compared to MyChillNews. In my definition of stress score, the numerator is the sum of loves, hahas and thankfuls minus the sum of sad and angries. The denominator is the sum of loves, hahas, thankfuls, sads, angries and wows. I decided not to use wows in the numerator as from my anectodal evidence, wow can be used for both positive news and negative news.
Minor changes in requests response code and other changes for Python 3.
5. Data Analysis
In this sub-section, I analyze the collected data. First, I filter the dataframe by removing topics for which there are less than 25 articles and records with total number of reactions less than 10.
guardian_data.info()
<class 'pandas.core.frame.DataFrame'>
RangeIndex: 821 entries, 0 to 820
Data columns (total 18 columns):
link_name           821 non-null object
num_angries         821 non-null int64
num_comments        821 non-null int64
num_hahas           821 non-null int64
num_likes           821 non-null int64
num_loves           821 non-null int64
num_reactions       821 non-null int64
num_sads            821 non-null int64
num_shares          821 non-null int64
num_thankfuls       821 non-null int64
num_wows            821 non-null int64
status_id           821 non-null object
status_link         821 non-null object
status_message      821 non-null object
status_published    821 non-null object
status_type         821 non-null object
stress_score        821 non-null float64
topic               821 non-null object
dtypes: float64(1), int64(10), object(7)
memory usage: 115.5+ KB
# Making a copy on which we will perform the transformations

news_df = guardian_data.copy()
# Removing the records with number of reactions less than 10
# Total number of reactions includes the likes so they have to be removed

news_df = (news_df
           .loc[news_df['num_reactions'] -
                news_df['num_likes'] >= 10,:])
# Removing rows with topics which have a total number of articles less than 25

news_df = (news_df.groupby(['topic'])
              .filter(lambda x: len(x) >= 25))
5.1 Reaction Analysis
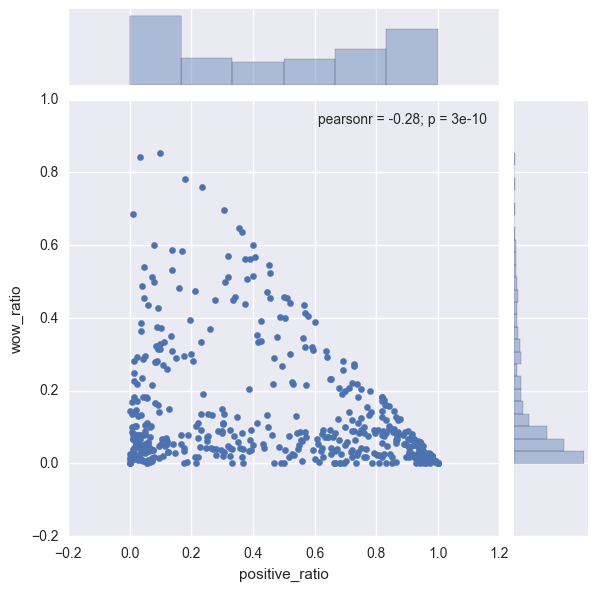
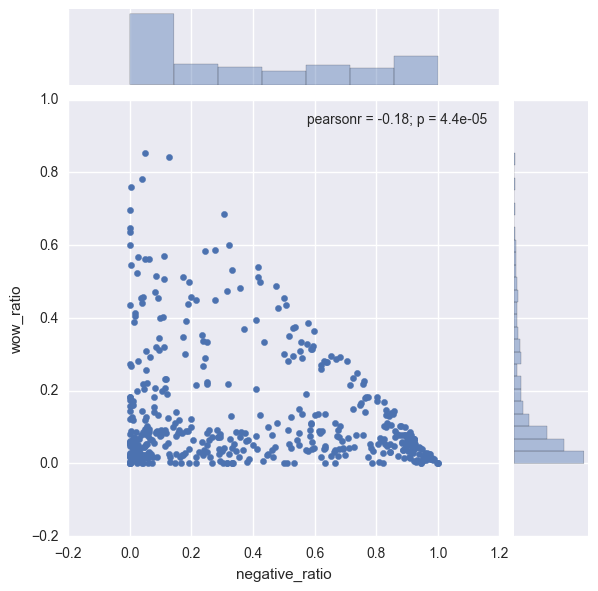
In this sub-section, we analyze the relationship between the different reactions after classifying them into positive and negative reactions. Also, I validate not using “wow” in the Stress score computation by showing that it does not have significant correlation with either positive reaction ratio or negative reaction ratio.
To analyze the relationship between positive reactions and negative reactions, I first compute positive reaction ratio and negative reaction ratio for each record. In short, they are the fractions of the total reactions on the record.
news_df['positive_ratio'] = ((news_df['num_hahas'] +
                                         news_df['num_loves'] +
                                         news_df['num_thankfuls']) / (news_df['num_reactions'] - news_df['num_likes']))

news_df['negative_ratio'] = (news_df['num_sads'] + news_df['num_angries']) / (news_df['num_reactions'] - news_df['num_likes'])

news_df['wow_ratio'] = news_df['num_wows'] / (news_df['num_reactions'] - news_df['num_likes'])
# Positive Reaction ratio - Negative Reaction ratio
# Bi-variate relationship

sns.jointplot(x = "positive_ratio", y = "negative_ratio", data = news_df)
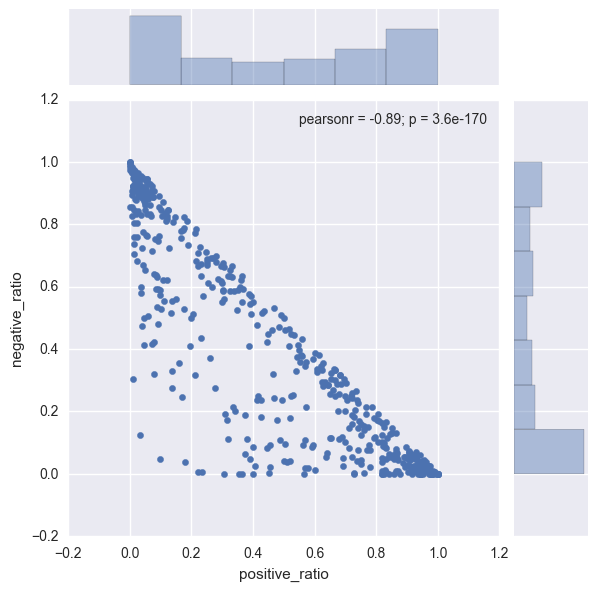
Observations:
- Positive reaction distribution: The biggest bars in the bar plot are at extremely low value of 0 or extremely high value of 1.
- ** Negative reaction distribution:** The highest bar is at 0 and evenly distributed across other ratio values.
- Strong negative correlation: The Pearson correlation coefficient is a high value of -0.89. From the distribution curves, majority of the points have high positive reaction score or high negative reaction score.
Next, I show wow reaction has little correlation with either the positive reaction ratio or negative reaction ratio.
sns.jointplot(x = "positive_ratio", y = "wow_ratio", data = news_df)
sns.jointplot(x = "negative_ratio", y = "wow_ratio", data = news_df)
5.2 Stress Score Analysis
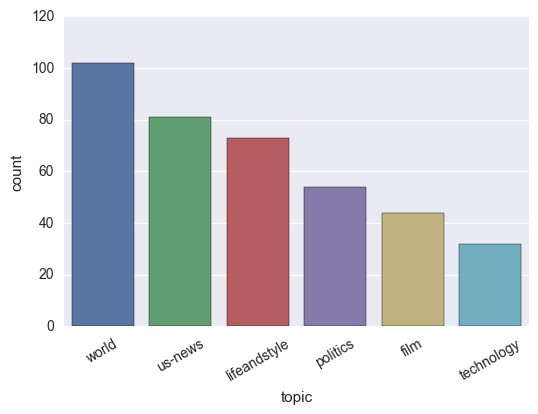
# Listing the top topics based on article count
top_topics = (news_df['topic']
              .value_counts()
              .sort_values(ascending = False)
              .head(10))

top_topics
commentisfree    112
world            102
us-news           81
lifeandstyle      73
politics          54
film              44
technology        32
Name: topic, dtype: int64
commentisfree seems to an irrelevant topic and therefore will be removed from further analysis.
news_df = news_df.loc[news_df['topic'] != 'commentisfree',:]
news_df['topic'].value_counts()
world           102
us-news          81
lifeandstyle     73
politics         54
film             44
technology       32
Name: topic, dtype: int64
g = sns.countplot(x = "topic", data = news_df,
              order = (news_df['topic'].
                       value_counts().index))
g.set_xticklabels(g.get_xticklabels(),rotation=30)
g = sns.boxplot(x = "topic", y = "stress_score", data = news_df,
              order = (news_df['topic'].
                       value_counts().
                       iloc[:].index))
g.set_xticklabels(g.get_xticklabels(),rotation=30)
plt.title("The Guardian")
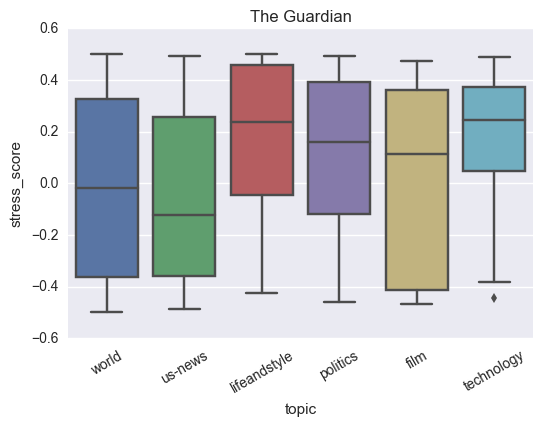
Observations:
Technology and Lifestyle topics have the highest positive scores indicating a positive reaction from the readers/
Interestingly, politics also has a positive score.
Interestingly, film news has the highest variance with the 25%-quantile point lying at -0.4.
US News has the lowest mean stress score indicating a higher probability of negative news compared to others. With the US-related news being largely negative ever since the recent elections, this is not surprising.
I performed similar analysis for also LA Times. This will allow us to compare the stress score across news agencies. The plot similar to above is displayed below.
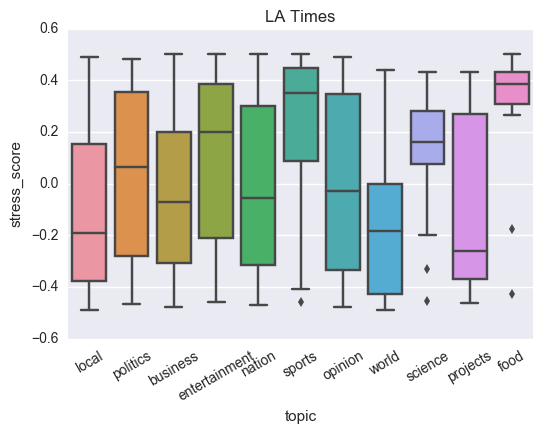
Observations:
We observe high positive scores for sports, food, science and entertainment.
Interestingly, world news has the lowest score in this case even lower than politics/business. This might be because the world news might be related to violence and destruction in other parts of the world.
6. Conclusion
In conclusion, I analyzed Facebook reaction data for news articles shared on the official pages of leading newspapers. My analysis shows a strong negative correlation between positive reaction ratio and negative reaction ratio for an article. Moreover, significant variance was observed in stress score across the different news topics!