
H-1B Visa Petitions Data Analysis using R (Part II): Data Analysis
8 minute read
This post is part of a series of blogs on exploration of H-1B visa petitions public dataset using R language.
Part II: Data Analysis
We’re now ready to interpret the data. I begin the data analysis by focusing on the employers with highest number of applications in the dataset and analyze the salaries offered by them with other popular employers. Next, I focus on the applications related to Data Science job positions. Last, I explore the distribution of Data Science related jobs across the US and the relationship with cost of living. Let’s begin!
The code used in this blog can be found on GitHub.
High Applicant employers
The questions I will be answering through data include:
1) Which Employers submit the most number of H-1B visa applications?
2) What is the Percentage share out of the 85,000 visa cap for the Employers with most applications?
3) What are the most common Job Titles applied for by the high applicant employers?
4) How do the salaries compare for Software jobs between high applicant employers and other popular employers?

Observations from Figure 1:
Infosys leads the pack by a huge margin with over 30000 applications in 2013 and 2015.
The Top 10 list is dominated by the Indian IT companies.
In 2016, we observe a slight dip in the number of applications from Infosys, Wipro, Tata Consultancy, IBM India and HCL America. This might be because of increased incorporation of automation in the IT industry. According to this recent article by an IT industry stalwart, the Indian IT firms have been preparing for reduced number of H-1B visas for nearly a decade through increased focus on automation, cloud computing and artificial intelligence.

In Figure 2, I assume each certified H-1B application corresponds to a unique H-1B visa. Accordingly, if an employer’s 8500 H-1B visa applications were certified then it’s percentage share in the 85,000 visa cap is 10%. I use the CASE_STATUS column in the records to find out if a H-1B Visa petition has been certified or not.
UPDATE: The CASE_STATUS field denotes the status of the application after LCA processing. Certified applications are filed with USCIS for H-1B approval. CASE_STATUS: CERTIFIED does not mean the applicant got his/her H-1B visa approved, it just means that he/she is eligible to file an H-1B. The random allocation is performed in the next stage by USCIS. For more details on this update, read this discussion on Kaggle. Credits go to Jagan Gurumurthy for figuring this out.
Based on this update, this plot represents the scenario when the companies shown in the figure have 100% success in the random allocation.
Observations from Figure 2:
Over 90% of the certified H-1B visa applications belong to the employers
Infosys takes the biggest share more than double than most of the remaining top 10 high-applicant employers.

Observations from Figure 3:
Technology related jobs fill up majority of the positions with the top 3 jobs being Technology Lead, Technology Analyst and Computer Programmer.
Consultant and Manager related jobs fill up the remaining spots.

Observations from Figure 4:
Expectedly, the Manager level jobs and Lead Consultant job titles have the highest wages.
The Software Engineering jobs including Programmer analyst, Computer Programmer, Computer Systems Engineer have wages close to 60000 USD per annum.
Test Analyst and Systems Engineer have the lowest wages with the median slightly above 50000 USD.
Based on this data, it will be interesting to find out how the wages offered to Software related job titles by the high-applicant employers compares with the top Software companies like Google, Amazon, Facebook etc. For this purpose, I filter job titles with terms including Programmer, Computer, Software, Systems and Developer from the dataset and consider these positions to be software jobs. Next, I compare the wages offered by 5 high-applicant companies including IBM, Infosys, Wipro, Tata Consultancy Services, Deloitte with Google, Amazon, Microsoft and Facebook.

Observations from Figure 5:
Clearly, the high-applicant employers with the most H-1B visas have significantly lower wages for Software job positions.
The median annual wage for the IT companies is lower than 70000 USD whereas for the top software companies the median wage is above 85000 USD.
Facebook and Google have a median above 100000 USD.
Next, I focus on the Data Science related job positions out of my personal interest.
Data Science Job analysis

Observations from Figure 6:
Data Scientist and Data Engineer positions have observed an exponential growth in the last 6 years.
Job Titles with Machine Learning explicitly in them are still few in number (< 75 in any year).
In 2016, Data Scientist position broke the 1000 barrier on the number of H-1B Visa applications.

Observations from Figure 7:
Machine Learning jobs have the highest median wage although the number of Job Titles with Machine Learning explicitly in them are less than 75 in any year.
Median wage for Data Engineer jobs is consistently increasing.
Median wage for Data Scientist positions is negligibly decreasing since 2012 although this is the position that has seen the most growth in the last 6 years.
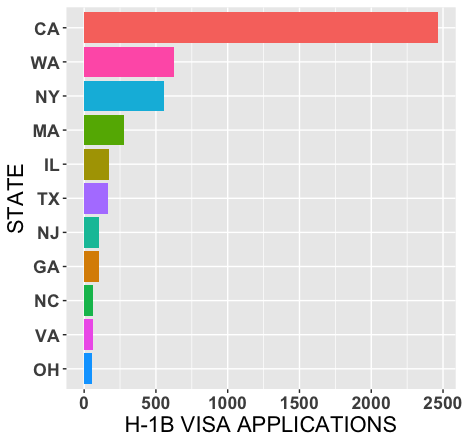
In Figure 8, I filtered states with 50 Data Science related jobs in the last 6 years. Hence, the figure doesn’t display all the US states. By Data Science job, I assume the Job title has Data Scientist or Data Engineer or Machine Learning in it.
Observations from Figure 8:
California leads the pack by a huge margin with over 2000 applications.
New York, Washington, Massachusetts and Texas form the remaining top 5 positions.
This result is expected as these states are hub of technology innovation with California housing the Silicon Valley, NY housing the Finance and media corporations, Washington housing the technology giants including Microsoft and Amazon.
- Surprisingly, only 11 states passed the barrier of 50 H-1B applications related to Data Science in the last 6 years.

Observations from Figure 9:
California has not only got the most number of jobs but also the highest wages. This might be due to the higher cost of living as I will analyze later.
Significant variation in the mean wage across the states.
I excluded Massachusetts as it had an weird mean Wage of 1500,000 USD per annum.
Next, I dive deeper into analyzing data science positions at the granularity of Worksite city.

Observations from Figure 10:
San Francisco leads the chart with the most number of jobs.
Inside California, the jobs are not uniformly distributed. Instead, are mainly clustered nearby San Francisco.
Cost of Living
Last, I explore the relationship between cost of living and the wage offered for Data Science jobs.

Observations from Figure 11:
A general increase in the Wage is observed with the cost of living although there are slight dips across the curve.
The standard deviation decreases as we move towards locations with higher cost of living index.
Conclusion and Future Work
To conclude, in this project, I performed exploratory data analysis on the H-1B visa petition disclosure data for the period 2011-2016. I found that the employers with the most number of H-1B visa applications pay significantly lower wages compared to other employers for similar job positions offered by other employers. Also, I found that the Data Scientist position has experiences an exponential growth in terms of H-1B visa applications. Interestingly, the Data Scientist jobs are still lustered in a few hotspots with San Francisco region having the highest number.
Additional analysis can be found in the kernel I shared on Kaggle. I will be discussing the H-1B curated dataset that I uploaded to Kaggle in a future blog post.
In the next blog of this series, I will present the design of the Shiny web app I created for users to perform their own exploration on the H-1B dataset. Thanks for reading!