H-1B Visa Petitions Data Analysis using R (Part IV): Kaggle Open Data
3 minute read
This post is part of a series of blogs on exploration of H-1B visa petitions public dataset using R language.
Part IV: Kaggle Open Data
In this blog, I describe briefly my experience publishing the H-1B visa dataset on Kaggle.
After I finished creating the Shiny web app and posted my blog on [NYC Data Science Academy][nyc-dsa], the blog was picked up by R-bloggers, the most popular blog aggregator for articles related to R language. I observed a positive interest from the readers to further explore this dataset. This enthusiasm was a key driver in publishing the H-1B visa dataset on Kaggle Datasets platform.
Kaggle: Your Home for Data Science
According to Wikipedia,
Kaggle was founded as a platform for predictive modeling and analytics competitions on which companies and researchers post their data and statisticians and data miners from all over the world compete to produce the best models.
In 2017, Kaggle has not only become a central hub for Machine Learning competitions but also one of the best platforms for open datasets! Personally, I love the Kaggle kernels where you can explore codes and visualizations of fellow Kagglers and also share your own work. While getting my hands dirty with the famous Titanic dataset, I picked up a ton of skills including XGBoost algorithm design, state-of-the-art stacking techniques and feature selection tricks just from reading the top Kaggle kernels and related forum discussion of the Titanic competition.
Dataset of the Week!

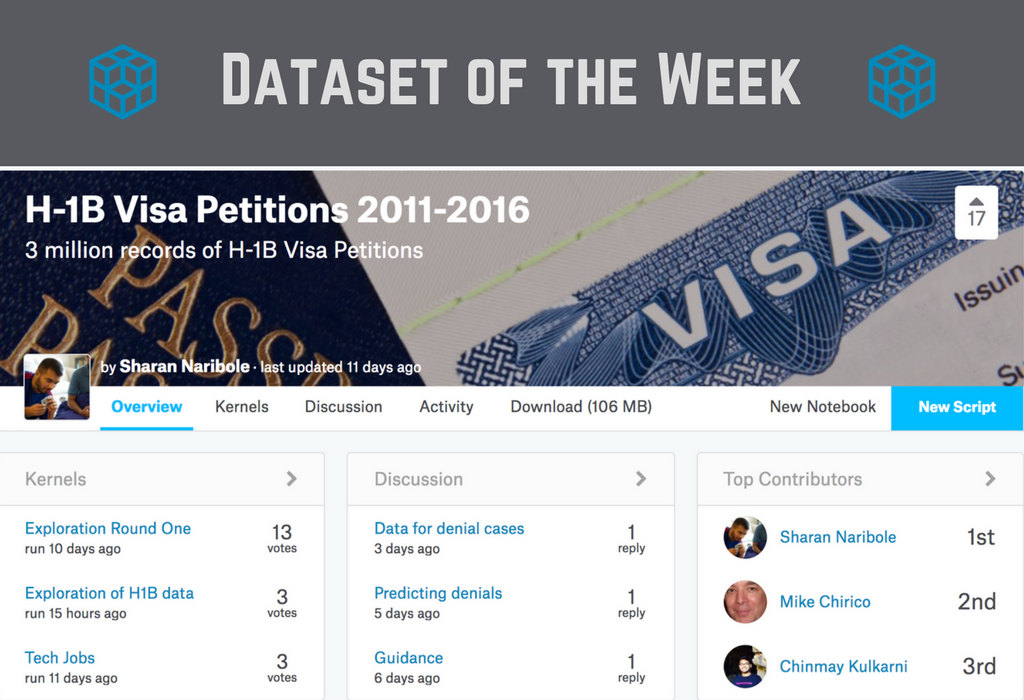
Two weeks after the H-1B dataset was published, I was delighted to receive an email from Megan Risdal, Marketing Manager at Kaggle informing me that my dataset was chosen as Dataset of the Week for March 15 - March 16 2017. It will also be included in the first of Kaggle’s new monthly blog series “Dataset of the Week” as well as the newsletter.
The dataset got promoted on Kaggle’s social media including Twitter and Facebook. In the first two and half weeks of dataset getting published, there have nearly 1000 downloads and 56 kernels created to explore the dataset.
Kaggle Dataset
The instructions provided while uploading to Kaggle were quite helpful. Due to the 500 MB limit on data upload, I made slight changes to the dataset I used for my own analysis and for the Shiny app. The columns in the dataset include:
CASE_STATUS: Status associated with the last significant event or decision. Valid values include “Certified,” “Certified-Withdrawn,” Denied,” and “Withdrawn”.
EMPLOYER_NAME: Name of employer submitting labor condition application.
SOC_NAME: Occupational name associated with the SOC_CODE. SOC_CODE is the occupational code associated with the job being requested for temporary labor condition, as classified by the Standard Occupational Classification (SOC) System.
JOB_TITLE: Title of the job
FULL_TIME_POSITION: Y = Full Time Position; N = Part Time Position
PREVAILING_WAGE: Prevailing Wage for the job being requested for temporary labor condition. The wage is listed at annual scale in USD. The prevailing wage for a job position is defined as the average wage paid to similarly employed workers in the requested occupation in the area of intended employment. The prevailing wage is based on the employer’s minimum requirements for the position.
YEAR: Year in which the H-1B visa petition was filed
WORKSITE: City and State information of the foreign worker’s intended area of employment
lon: longitude of the Worksite
lat: latitude of the Worksite
Conclusion and Future Work
This brings an end to this series on H-1B Visa Petitions Data Analysis using R. Hope you’ve enjoyed reading thus far and found something useful! Thanks
