
Reddit Sentiment-based Soccer Match Prediction
14 minute read
In this project, my goal is to predict the soccer match results based on the sentiment of the comments in the corresponding Reddit soccer (r/soccer) post-match threads.
First, I collect the raw data using reddit API. For each match, I design and compute various sentiment metrics classified by the commenter’s flair (team). Second, using statistical tests, I draw inferences on the variance in the sentiment for different flair types across different results. Using this analysis, I evaluate machine learning models for match result prediction based on the sentiment.
The code for this blog is on GitHub.
1. Introduction
Reddit is a social news website and forum where content is socially curated and promoted by site members through voting. Subreddits are communities centered around a topic, running from rather broad (like the r/worldnews subreddit) or super niche, like the subreddit for discussing Manchester United midfielder Ander Herrera’s goal celebrations (r/herreracelebrations/).
In this project, I focus on the subreddit for soccer content /r/soccer, comprising of an enormous community of over 500,000 subscribers. This is the largest sports-related subreddit! Hundreds of submissions (posts) are voted based on their content and discussed on a daily basis. The common submissions include live goals, news articles and pre-, live and post-match analysis. Many a time /r/soccer is where I vent my frustration whenever Manchester United suffers defeat! The anonymity of Reddit provides a powerful tool for users to express their opinions about the clubs they support and also rival clubs. This unique feature provides a mechanism to prevent the building of echo chambers which was a hot topic in the recently held 2016 US elections.
/r/soccer also provides each subscriber the feature to select a “flair” which is the team crest (team logo) of the club/country the user supports. A miniature team logo is displayed beside the username in their posts and comments. This gives other readers context and insight into the user’s thinking and adds another interesting dimension to the conversations that take place. In this project, I focus on the Post-Match Threads which are discussion threads created immediately after a soccer match has ended. My hypothesis is that the sentiment of the commenters supporting the team that lost is widely different from the commenters supporting the team that won. And when the game is a draw, the sentiment for both teams might be a bit closer. However, during the 90 min of football, one usually goes through a wide variety of emotions independent of your team winning or losing. Sometimes the result might be a draw but the equalizer would’ve been scored in the dying minutes of the game. In that case, the supporters of the team that scored in the final minutes are expected to have a better feeling at the end of the game. Is it possible to capture these emotions in the post-match threads? That is basically the goal of this project.
Using Python Reddit API wrapper (praw), we can easily extract Reddit data. You can filter submissions from a particular subreddit during a specific period and add additional search queries to filter the submissions. For a given submission, you can access the data at individual comment level. For example, in this project, I utilize the top 10 comments for each flair type
2. Setup
# Data Collection and Transformations
import praw
import numpy as np
import pandas as pd
import datetime as dt
import time
import unicodedata
import re
import editdistance
import pickle
from sklearn.preprocessing import Imputer

# Sentiment Analysis
from textblob import TextBlob

# Statistical Testing
import statsmodels.api as sm
from statsmodels.formula.api import ols
import scipy

# Machine Learning
from sklearn.model_selection import train_test_split, cross_val_score
from sklearn.linear_model import LinearRegression, LogisticRegression
from sklearn.model_selection import learning_curve
from sklearn.naive_bayes import GaussianNB
from sklearn.ensemble import VotingClassifier
from sklearn.metrics import roc_curve, auc, classification_report

# Class imbalance
from imblearn.over_sampling import SMOTE
from imblearn.pipeline import make_pipeline

# Plotting
import matplotlib
import matplotlib.pyplot as plt
plt.rcParams['figure.figsize'] = [10,8]
import seaborn as sns
%matplotlib inline
3. Data Collection
In this sub-section, I perform the data collection and computation of the metrics of interest. Our final dataframe will include each submission in its own row and its metrics and other info in the columns. Therefore, the metrics are computed at a per-submission granularity. The key concepts of data generation are as follows:
Match Info: For each Post-Match Thread (submission), I find out the two teams that are taking part and the Match Score. This information can be obtained using regular expressions on the submission title alone. The title is usually in the following format: [Post Match Thread] Manchester United 3-0 Liverpool (English Premier League). In this classification, Manchester United is the home team, Liverpool is the away team and the final score is 3-0. The match result has 3 possible values: 1 if home team wins, 0 in case of a draw and -1 when the away team wins.
Flair-based Classification: Once the team names are learnt, I classify the comments based on the commenter’s flair i.e. supporting team. There are 3 classes of classification: Home, Away and Others. Others refers to commenters with other team flairs.
Per-Flair Sentiment Metrics: For each flair type, I find out the top Ntop (default=10) comments among all the comments in the submission. Then, using textblob NLP package, I find out the subjectivity and sensitivity of the filtered comments individually and together. I compute the weighted averages of sentiment polarity based on two kinds of weight, subjectivity and comment score. Also, the standard deviation in the polarity is recorded.
Apart from the sentiment metrics, I also collect the submission score (~ number of upvotes), total number of comments and submission creation time. In this manner, each record is generated. For this project, I used submissions during the period Feb 9, 2014 to April 5, 2017. To reduce the standard deviations in the user sentiment within a flair typeof a given submission, I only used the submissions with a minimum of 100 comments.
The following cells in this sub-section of the Jupyter notebook execute the above key concepts in code.
4. Exploratory Data Analysis
To analyze the sentiment analysis in isolation, I do not consider the team names, submission scores and number of comments as features for the match result prediction. Therefore, the features include only polarity metrics. The response variable is the Match result.
Before the transform, we split the dataset into training(90%) and test (10%) sets. I use the test dataset only for the final prediction.
train_df, test_df = train_test_split(raw_df, test_size = 0.1)
Interestingly, all of our polarity metrics have positive medians just above 0 with a standard deviation close to 0.25. Strangely, the mean comment score weight polarity for Team B is Infinite. This might be an error arising out of the underlying package textblob that computes the polarities. Simples way to address such values is to replace them with NaN. Next, I fill the missing values.
X_train.replace([np.inf,-np.inf],np.nan,inplace=True)
X_test.replace([np.inf,-np.inf],np.nan, inplace=True)
4.1 Home Team Advantage
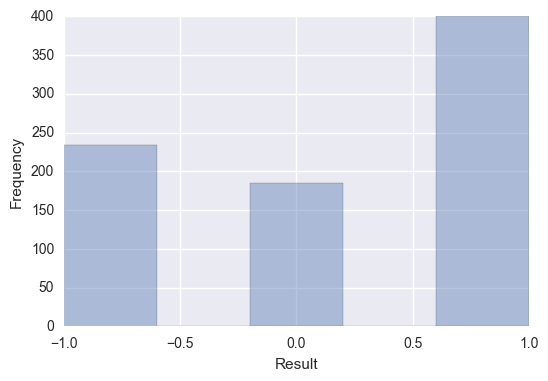
Clearly, there is an imbalance among our classes as shown below. The number of wins by Home Team is roughly equal to the same of draws and losses by home team. This is called the Home Advantage in soccer as the home team is more adept to the match condition coupled with the majority of match attendees supporting the home team.
We need to factor this imbalance during our prediction modeling.
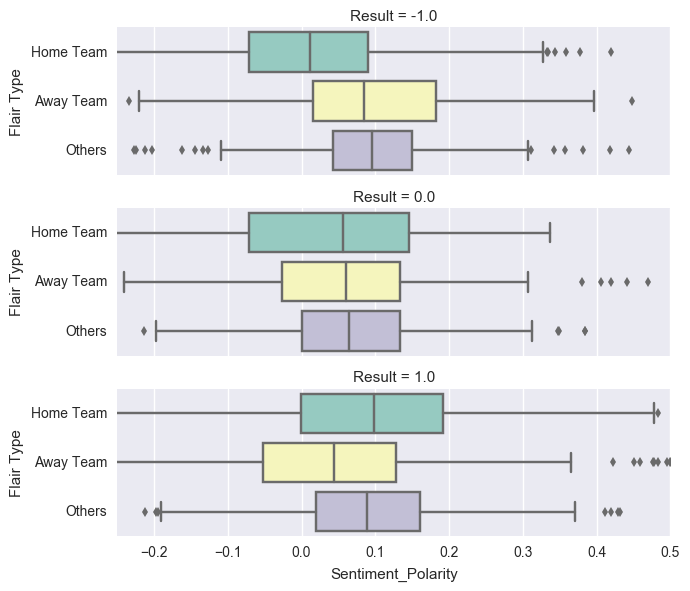
Observations:
The median Polarity for Home Team drops when the result is -1 (Home Team Loss). This is expected according to our hypothesis.
The median Polarity for Away Team is lowest when the result is 1.0 (Home Team Win).
The median Polarity for Others flair type is surprisingly lowest when the result is a draw.
However, the scale of these differences is negligible. For example, the difference in medians for the Home Team between Home Win and Home Loss is 0.1. This is negligible compared to the range of [-1,1] for sentiment polarity we obtained using textblob package. The difference is even more negligible for the other flair types.
Next, I perform statistical test to find out, for each flair type, if the differences in the means of observed sentiment polarities under different classes can be explained by the sampling variability of the null hypothesis.
5. Inferential Statistics
In this hypothesis, first, I will analyze the statistical significance of the differences in home team sentiment polarities for the groups of home team win, draw and home team loss. This testing will be performed independently for each flair type. The statistical test that best suits this scenario is the 1-way analysis of variance (ANOVA) test.
5.1 State Hypothesis
Null hypothesis: The mean Home Team comment score-weighted polarity is same for the groups Home Team Win, Draw and Home Team Loss.
Alternative hypothesis: The mean Home Team comment score-weighted polarity is different for at least one pair among the groups Home Team Win, Draw and Home Team Loss.
5.2 Check Conditions for 1-way ANOVA
Independence: The observations should be independent within and across groups. In our case, each observation represents a separate thread. As there are 500,000 users on the sub and our polarity metric computation that involves only the top 10 comments, we can assume the users contributing to our metrics are different. There is no overlapping of the matches between the groups as the Home team can either lose, win or draw. Hence, the assumption of independence across the groups is reasonable.
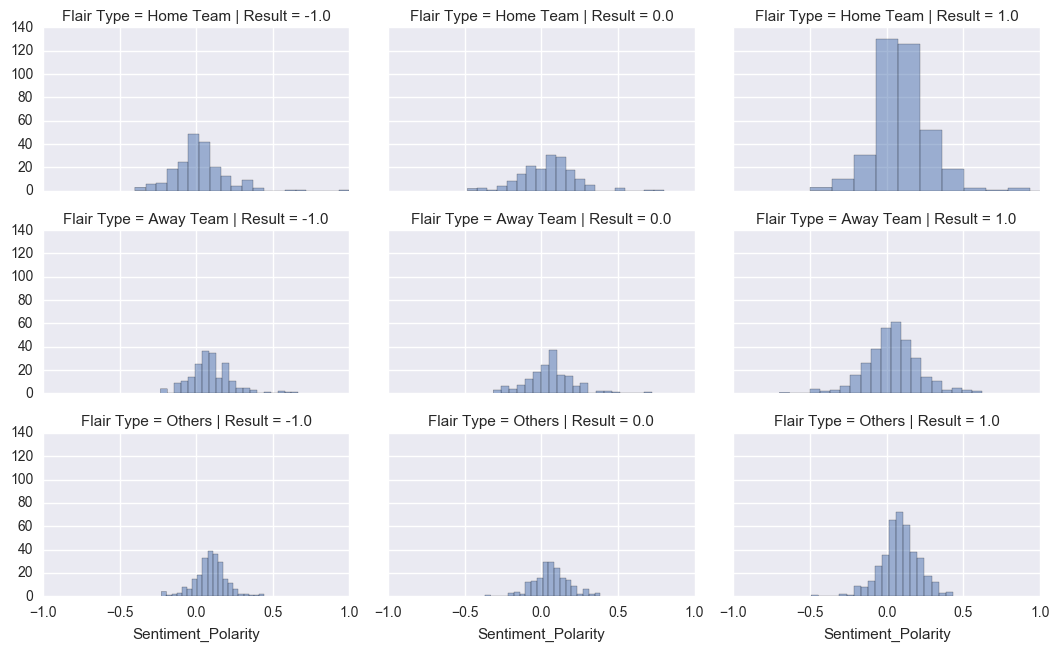
Normality: The data within each group should be nearly normal. Based on the figure below, none of the distributions seem to have extreme skewness.
Variability: Based on the box plots shown above, the variability for the Home Team is nearly same across the groups with a slightly bigger variation when there is a draw.
HOME TEAM ANOVA test
             sum_sq     df          F        PR(>F)
Result     1.013946    1.0  27.149419  2.440290e-07
Residual  27.823417  745.0        NaN           NaN
AWAY TEAM ANOVA test
             sum_sq     df          F    PR(>F)
Result     0.385107    1.0  14.738866  0.000135
Residual  18.028769  690.0        NaN       NaN
Others ANOVA test
             sum_sq     df         F    PR(>F)
Result     0.001699    1.0  0.124452  0.724346
Residual  11.153112  817.0       NaN       NaN
Observations:
Clearly, the p-value for the f-statistic obtained for the Home Team ANOVA test and Away Team ANOVA test are much lower than the significance level of 0.05. This provides us convincing evidence that the means for all possible match results aren’t the same for Home Team sentiment polarity and Away Team sentiment polarity.
In contrast, the p-value for Others ANOVA test is 0.7243246 and hence we fail to reject the null hypothesis. Combining this test result with our initial exploratory data analysis, we can remove the sentiment metrics related to Others flair type without any harm.
6. Data Imputation
X_train.isnull().sum()
Home Team Score Pol       72
Home Team Subject Pol     72
Home Team Pol SD          72
Home Team Merged Pol      16
Away Team Score Pol      127
Away Team Subject Pol    126
Away Team Pol SD         110
Away Team Merged Pol       0
Others Score Pol           0
Others Subject Pol         0
Others Pol SD              0
Others Merged Pol          0
dtype: int64
Values are missing for a Team when there are no commenters in the thread using the team’s flair. This is expected at a greater scale for less popular teams/ teams with small fanbase. For polarity metrics, we could have assigned the value of 0 but that would indicate no sentiment. Therefore, the strategy I employ is to fill the missing values using the median value.
I prefer median imputation as median is more robust to outliers in the data.
With all missing values filled, let’s analyze the relationship of our predictors with the response variable. Before that, let’s standardize the distributions of our predictors so they are on the same scale.
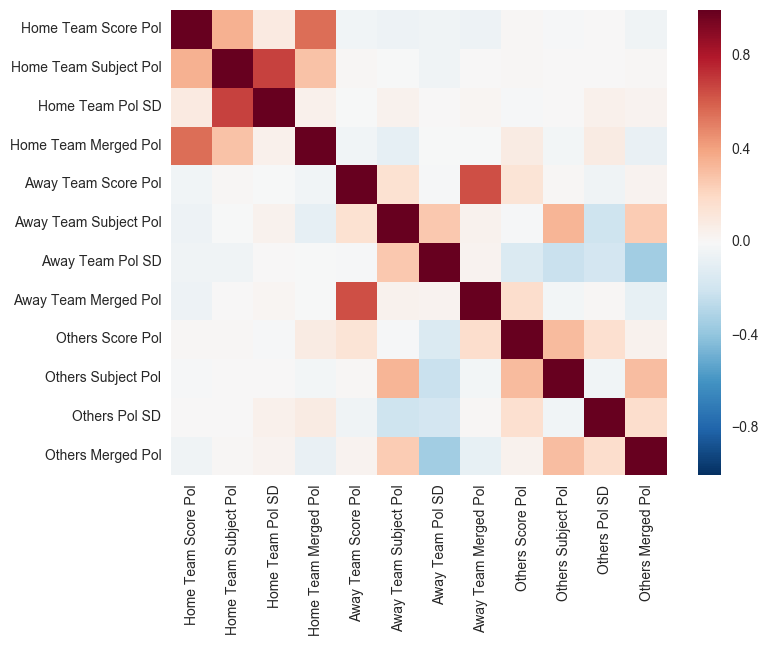
Observations:
- Negligible correlation between the sentiment polarities of the Home and Away flair types.
7. Binary Classification
To make the problem simpler, I consider a binary classification problem to differentiate between a draw and a win/loss. I will return to the multi-class classification problem in the future.
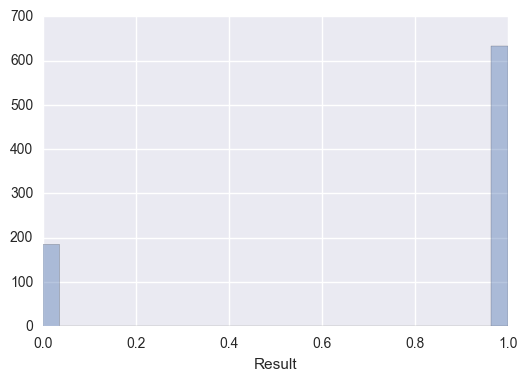
Clearly, there is an imbalance among the classes with over 75% belonging to the win/loss class. Let’s analyze how sampling during the training places an important role in giving us the right estimate of our training and validation accuracy. Performing basic sampling will give us a overly-optimistic estimate of our performance.
To overcome this, I utilize SMOTE: Synthetic Minority Over-sampling Technique implemented in imbalanced-learn, a python package offering a number of re-sampling techniques commonly used in datasets showing strong between-class imbalance. It is compatible with scikit-learn and is part of scikit-learn-contrib projects.
7.1 Imbalanced Class - Impact of Sampling
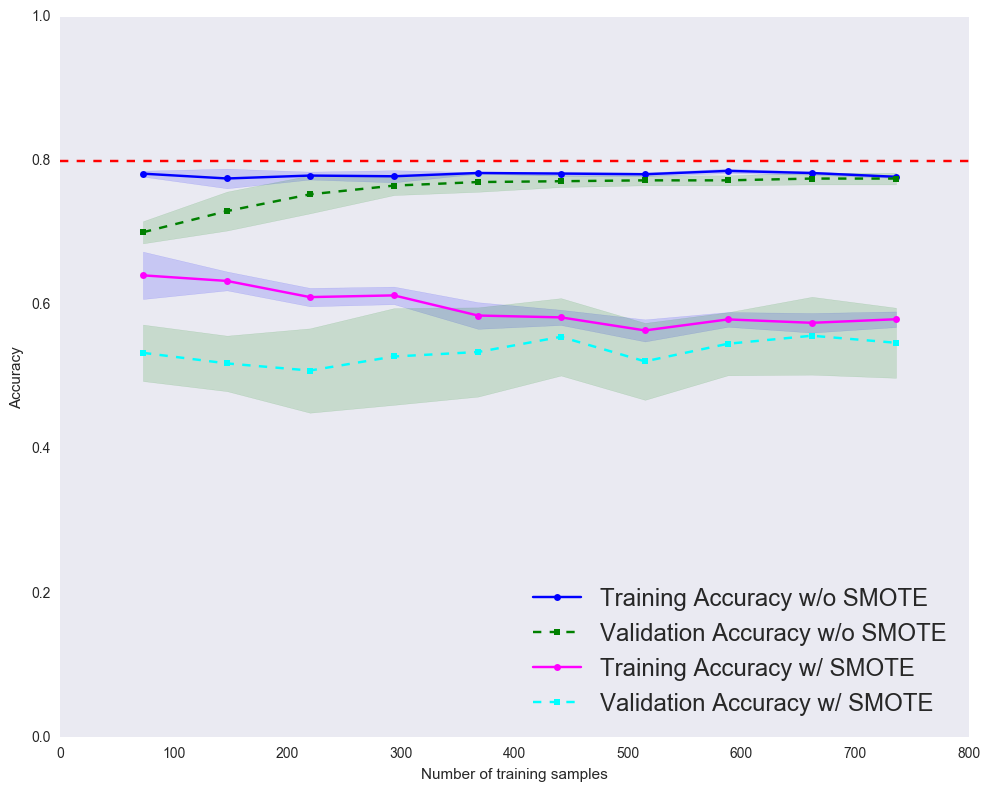
We observe both our training and validation accuracy well-below the desired accuracy. This indicates that our simple model underfits the training data.
7.2 Ensemble Voting classifier
10-fold cross validation:

ROC AUC: 0.54 (+/- 0.08) [Logistic Regression]
ROC AUC: 0.55 (+/- 0.08) [Random Forest]
ROC AUC: 0.53 (+/- 0.06) [Gaussian NB]
ROC AUC: 0.50 (+/- 0.05) [KNN]
ROC AUC: 0.54 (+/- 0.04) [Voting - Soft]
7.3 Classification Report
pipe_gnb.fit(X_train,y_train)
y_pred = pipe_gnb.predict(X_test)

print(classification_report(y_test, y_pred, target_names=['Draw','Win/Loss']))
             precision    recall  f1-score   support

       Draw       0.20      0.89      0.33        19
   Win/Loss       0.78      0.10      0.17        73

avg / total       0.66      0.26      0.20        92
pipe_rf.fit(X_train,y_train)
y_pred = pipe_rf.predict(X_test)

print(classification_report(y_test, y_pred, target_names=['Draw','Win/Loss']))
             precision    recall  f1-score   support

       Draw       0.22      0.53      0.31        19
   Win/Loss       0.80      0.51      0.62        73

avg / total       0.68      0.51      0.56        92
Observations: The Gaussian NB and Random Forest Classifiers differ in their Recalls. Gaussian NB has a high Recall of 0.89 for Draw
8. Conclusion
In this project, I analyzed the sentiment polarity in the comments of Reddit’s soccer subreddit. Using statistical tests, I found convincing evidence that the mean comment score-weighted sentiment polarity is different across match results for Home team commenters and Away team commenters. Next, I perform data cleaning to prepare the data for prediction analysis. I showed that when there are imbalanced classes, under-sampling and over-sampling techniques are essential for a more realistic estimate of the performance. Finally, I compared various machine learning models and showed that Sentiment polarity metrics in isolation provide poor performance in Match Result prediction. Thanks for reading!